Latest Infographics

Infographic
Automating NGS Workflows
This infographic highlights how specialized automation modules can be implemented throughout NGS workflows – from thermal cycling to magnetic bead handling.

Infographic
Is My Food Full of PFAS?
This infographic highlights how PFAS enter the food chain, identifies the foods most affected and outlines the gaps in current regulations, providing essential insights for anyone concerned about what’s on their plate.

Infographic
The Science That Keeps Biofuels Flowing
This infographic explores how to apply the right analytical technique during multiple stages of bioethanol and biodiesel production.

Infographic
Is Your Lab Balance Built To Last?
This infographic highlights how modern lab balances are redefining environmental standards through material reuse, efficient energy use and end-of-life recyclability.
Infographic
Optimize Patient Outcomes With LC-MS in Therapeutic Drug Monitoring
This infographic explores how liquid chromatography–mass spectrometry (LC-MS) offers the precision, sensitivity and reliability needed to overcome these challenges in the clinical setting.

Infographic
Transform Water Safety Testing With the Latest Analytic Tools
This infographic provides essential insights into the complex landscape of water contamination, from inorganic heavy metals to persistent organic compounds, helping labs navigate global regulations and implement advanced testing methodologies.
Infographic
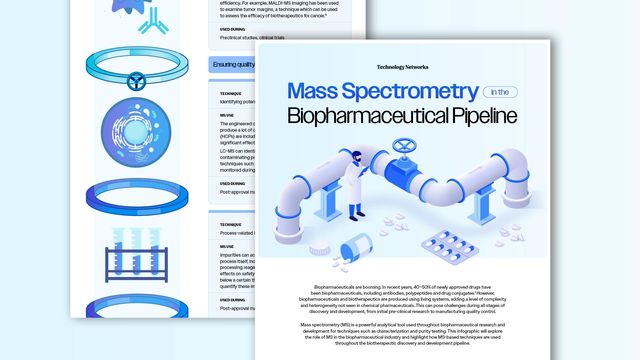
Mass Spectrometry in the Biopharmaceutical Pipeline
This infographic explores how MS-based techniques drive innovation in biopharmaceutical development, helping researchers overcome analytical challenges and optimize biotherapeutic characterization.

Infographic
Speed Up Quality Control for Safer Cell Therapies
This infographic explores a real-time PCR-based approach that delivers sterility test results within three hours. It also highlights innovations that reduce handling, minimize false negatives and detect over 95% of known bacterial contaminants.

Infographic
The Essentials of Sample Preparation
This infographic highlights key steps and essential tools to optimize workflows, enhance reproducibility and protect sensitive analyses from preventable errors.
Infographic
Achieve Precision in Analytical Sample Prep
This infographic explores tools and strategies to optimize each stage of sample preparation while aligning with industry standards.
Advertisement