Latest Infographics

Infographic
Is Your Lab Balance Built To Last?
This infographic highlights how modern lab balances are redefining environmental standards through material reuse, efficient energy use and end-of-life recyclability.
Infographic
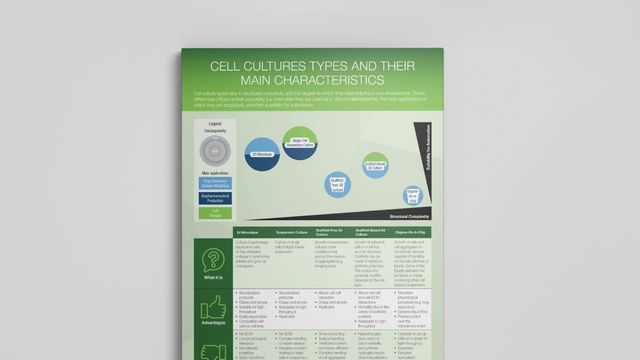
Compare Cell Culture Systems at a Glance
This infographic highlights the core characteristics of five widely used culture types, helping you assess which platforms meet your biological and operational needs.
Infographic
Streamline Your Biobanking Operations
This infographic highlights a standardized approach to ensure sample integrity and traceability across all critical stages.
Infographic
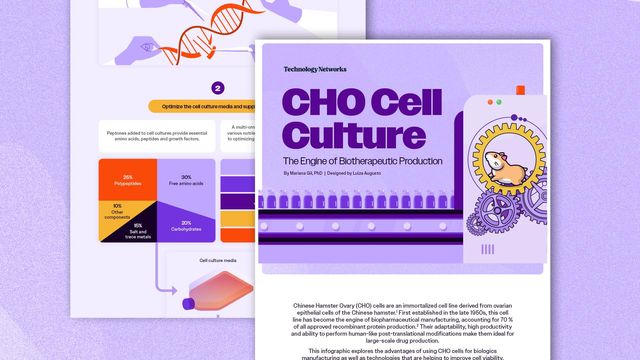
CHO Cell Culture: The Engine of Biotherapeutic Production
This infographic highlights the key advantages of CHO cells and the technologies that are pushing the boundaries of cell culture productivity.
Infographic
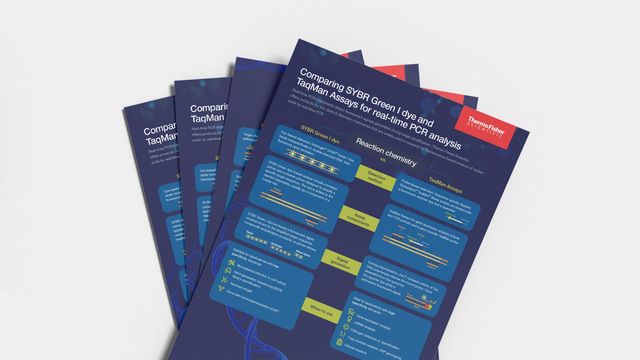
Choose the Right Reaction Chemistry for Real-Time PCR
This infographic explores key differences to help researchers determine the most suitable approach for their experimental workflows.
Infographic
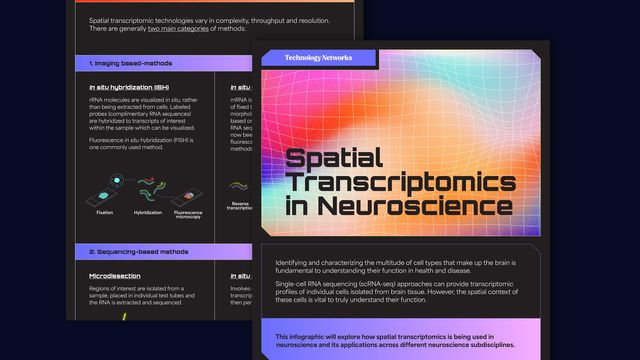
Spatial Transcriptomics in Neuroscience
Single-cell RNA sequencing (scRNA-seq) approaches can provide transcriptomic profiles of individual cells isolated from brain tissue.
Infographic
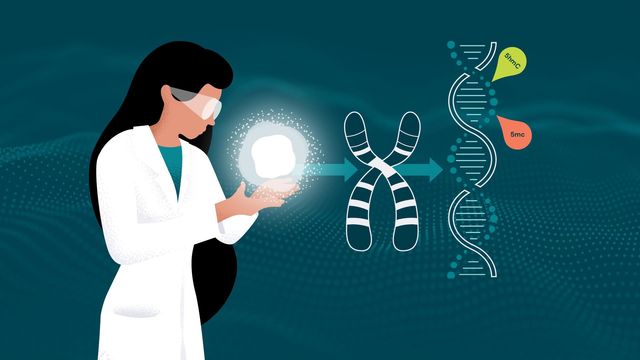
Reveal the Power of the 6-Base Genome
This infographic explores how this "6-base genome" approach helps researchers better understand gene expression and disease mechanisms by integrating epigenetic markers with genetic data.
Infographic
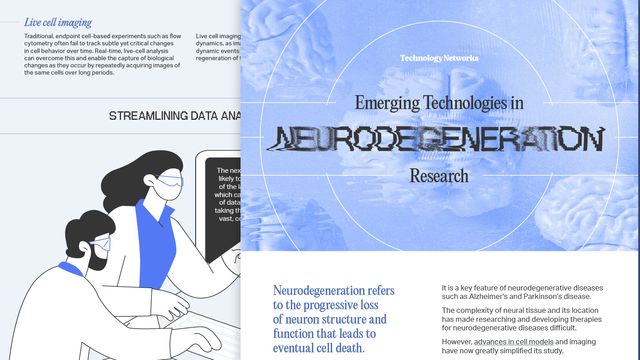
Emerging Technologies in Neurodegeneration Research
Download this infographic to explore the latest advances in modeling neurodegeneration and learn how to get the most out of your cell models.

Infographic
Cell‒Cell Communication in Health and Disease
Download this infographic to explore the types of signaling, learn how signals are transmitted and discover techniques for studying cell communication.
Infographic
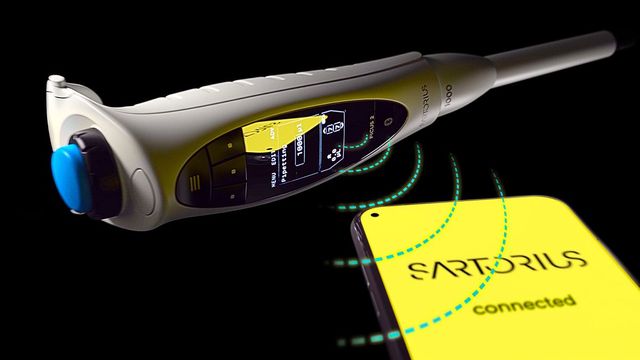
Experience the Picus® 2 Difference
How Picus® 2 Benefits Your Pipetting
Advertisement