Latest Infographics

Infographic
Automating NGS Workflows
This infographic highlights how specialized automation modules can be implemented throughout NGS workflows – from thermal cycling to magnetic bead handling.
Infographic
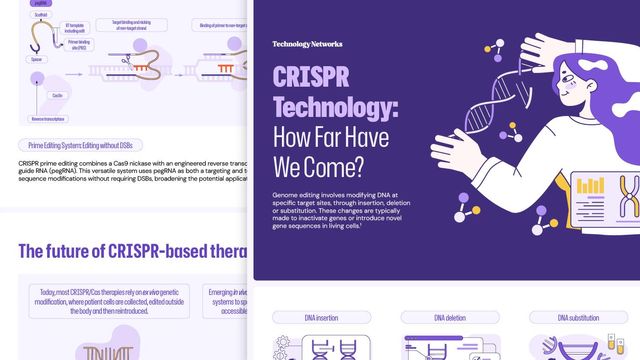
CRISPR Technology: How Far Have We Come?
This infographic explores the history, breakthroughs and future directions of CRISPR-Cas systems, highlighting their transformative role in gene editing and personalized medicine
Infographic
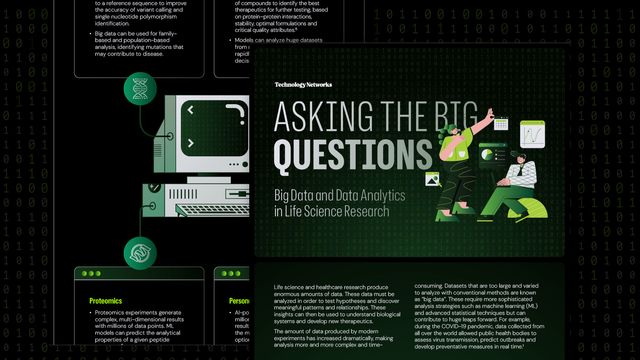
Asking the Big Questions: Big Data in Life Science Research
This infographic explores the strategies and techniques required for big data analytics, such as machine learning, and how these data are contributing to advancements across life sciences and healthcare.

Infographic
Parkinson’s Disease Mechanisms and Therapeutic Advances
This infographic outlines the mechanisms at the heart of PD and highlights investigational therapies, from gene and cell-based approaches to innovations targeting α-synuclein and neuroinflammation.

Infographic
Decoding Rare Diseases: How Genomics Is Transforming Diagnosis
This infographic explores how genomic technologies are enabling earlier and more precise diagnoses for patients.

Infographic
Choose the Right Reaction Chemistry for Real-Time PCR
This infographic explores key differences to help researchers determine the most suitable approach for their experimental workflows.

Infographic
How To Choose Between Real-Time and Digital PCR Technologies
This infographic breaks down the technology behind each technique, as well as their workflows, applications and important the benefits of each approach.

Infographic
Reveal the Power of the 6-Base Genome
This infographic explores how this "6-base genome" approach helps researchers better understand gene expression and disease mechanisms by integrating epigenetic markers with genetic data.

Infographic
Your Guide to Mastering Magnetic Bead Characteristics
This infographic deciphers how each characteristic influences magnetic bead separation and explores strategies to achieve optimal performance.

Infographic
Synthetic Biology in Medicine
Download this infographic to learn about medical applications for synthetic biology, such as diagnostics and biosensors, cell therapy and precision medicine, and synthetic bacterial therapeutics.
Advertisement

