Latest Infographics
Infographic
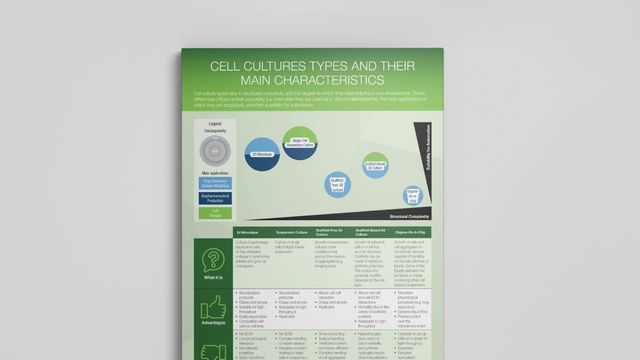
Compare Cell Culture Systems at a Glance
This infographic highlights the core characteristics of five widely used culture types, helping you assess which platforms meet your biological and operational needs.
Infographic
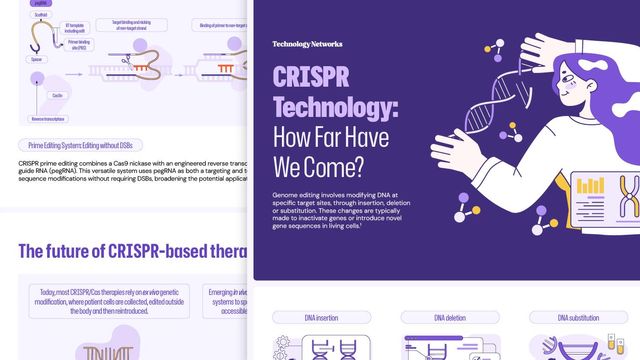
CRISPR Technology: How Far Have We Come?
This infographic explores the history, breakthroughs and future directions of CRISPR-Cas systems, highlighting their transformative role in gene editing and personalized medicine
Infographic
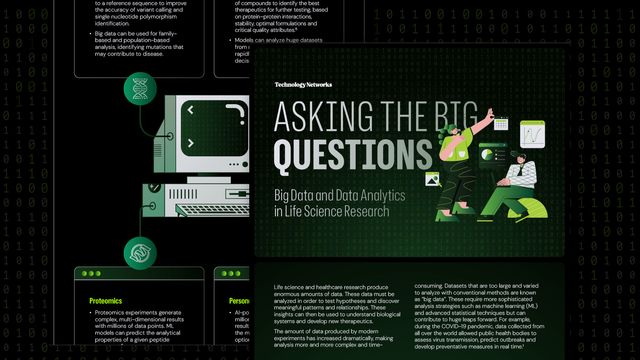
Asking the Big Questions: Big Data in Life Science Research
This infographic explores the strategies and techniques required for big data analytics, such as machine learning, and how these data are contributing to advancements across life sciences and healthcare.
Infographic
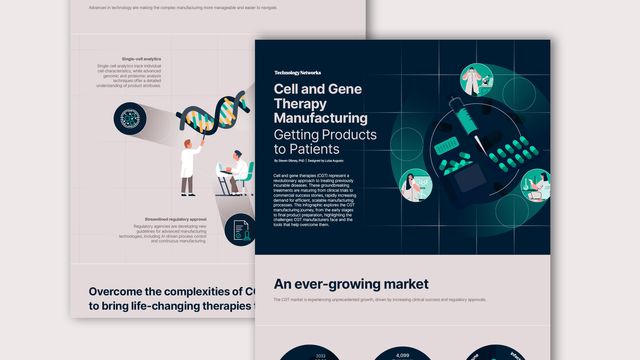
Navigating Cell and Gene Therapy Manufacturing
This infographic explores the complete CGT manufacturing journey, from source material acquisition to final product preparation, highlighting key challenges and emerging technological solutions.
Infographic
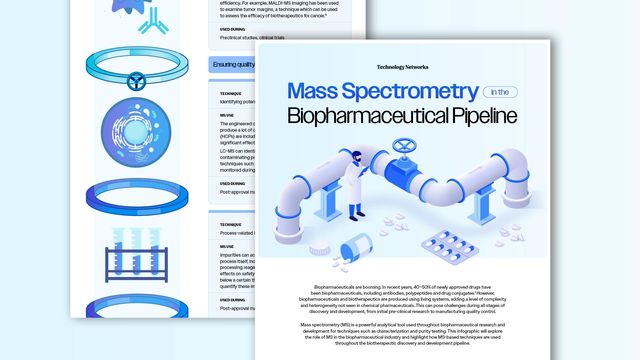
Mass Spectrometry in the Biopharmaceutical Pipeline
This infographic explores how MS-based techniques drive innovation in biopharmaceutical development, helping researchers overcome analytical challenges and optimize biotherapeutic characterization.

Infographic
Speed Up Quality Control for Safer Cell Therapies
This infographic explores a real-time PCR-based approach that delivers sterility test results within three hours. It also highlights innovations that reduce handling, minimize false negatives and detect over 95% of known bacterial contaminants.
Infographic
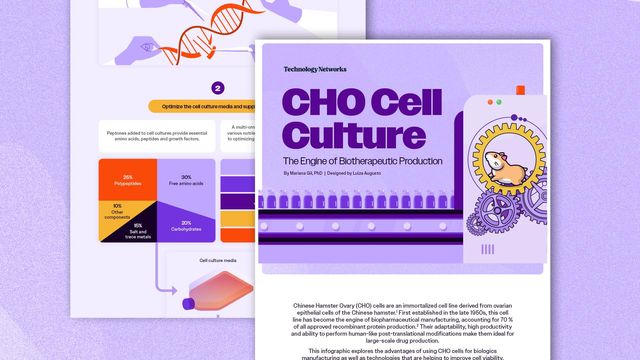
CHO Cell Culture: The Engine of Biotherapeutic Production
This infographic highlights the key advantages of CHO cells and the technologies that are pushing the boundaries of cell culture productivity.
Infographic
Choosing the Best Vial for Your LC and LC-MS Experiment
This infographic explores how vial composition affects analysis and provides solutions for reducing contamination and improving reproducibility.
Infographic
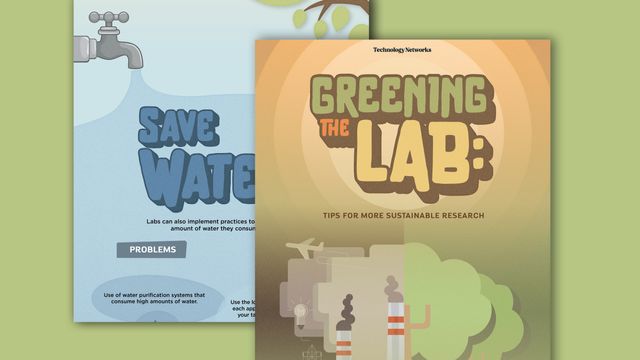
Greening the Lab: Tips for More Sustainable Research
This infographic explores solutions for energy and water conservation as well as waste reduction, offering actionable insights to make your lab more sustainable.
Infographic
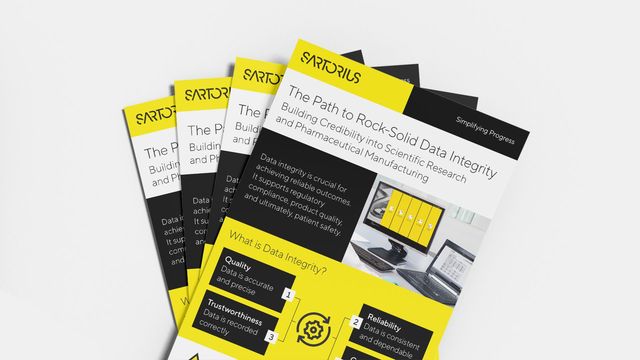
How To Achieve Rock-Solid Data Integrity
This infographic highlights strategies for managing lab data effectively to help researchers and manufacturers achieve regulatory compliance.
Advertisement